Seacoast NH Real Estate Market Data & Trends

Seacoast, NH Real Estate Market Data & Trends - Q1/2026

 As a Seacoast realtor with a background in IT Analysis, I like to go above and beyond sending potential home sellers a basic generated home value number. I like to take a deeper drive into the data, and present multiple methods in hopes to find correlation and further support our pricing strategy. Here is the current state of the Rockingham County market.

SecoastNHRealEstateTrends

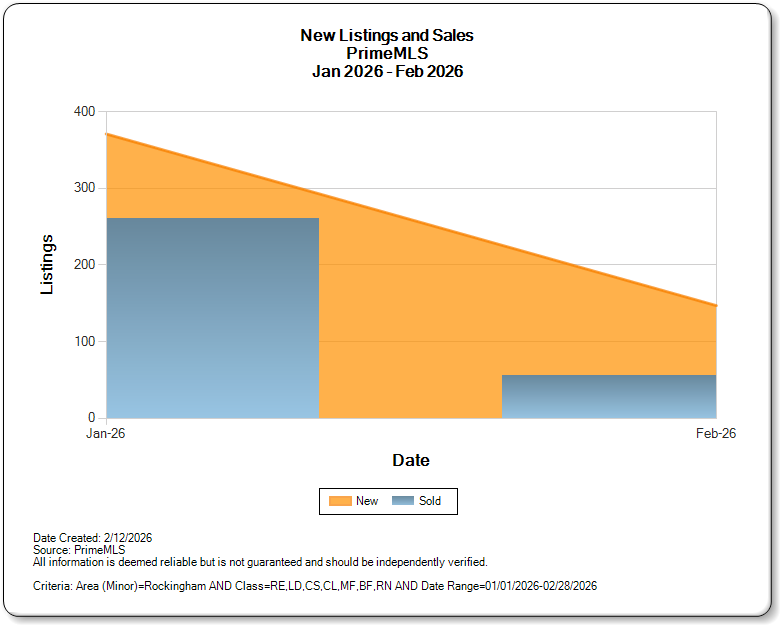
Seacoast NH Real Estate Listings vs Sales Jan-Feb

While not a surprise as winter months on the Seacoast NH Real Estate market continues to show low inventory, with

The Town-by-Town Comparison

TownMedian Price (2026)Inventory StatusBest For
Portsmouth$763,866Extremely TightWalkability & Tech Hub
Rye$1,198,048Low/LuxuryWaterfront & Privacy
Hampton$645,816IncreasingBeach Access & Commuters
Seabrook$645,816StableValue & Retail Access

Current Days on Market (DoM) in Rockingham County

Home Pricing Strategy

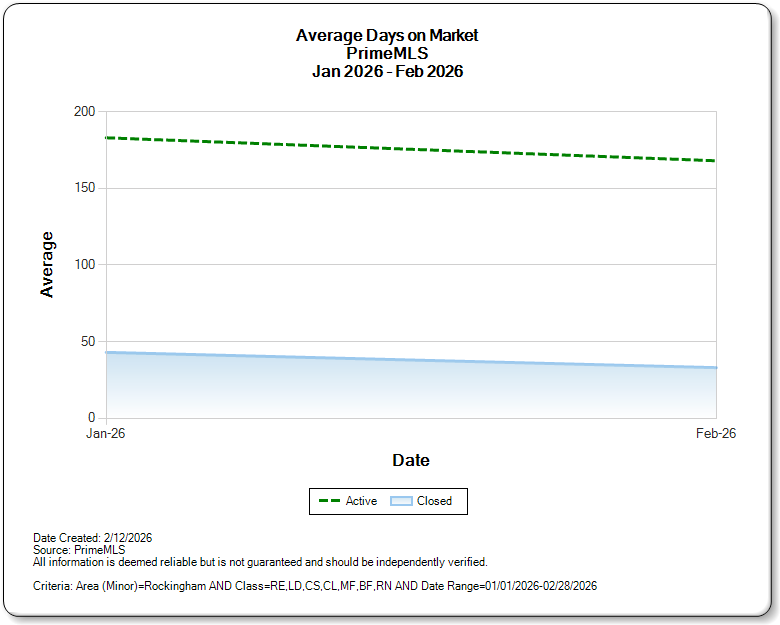
Average Days On Market

While there isn't a lot of data yet in Q1 to properly form an analysis. You can see that the DoM continues to decline. This can mean 1 of 2 things - Homes are increasingly being priced at values that Buyers see desirable, or that we are having price drops, showing values were too high, properties sat in January, and eventually were reduced to a price that was deemed fair by Buyers.

Property Type Comparison

This helps you rank for “Seacoast condo market vs single family.”

Property TypeAvg. PriceAvg. Days on MarketMarket Sentiment
Single Family$710k18 DaysHigh Competition
Condominiums$415k25 DaysBalanced
Luxury ($1.5M+)$2.1M45 DaysSelective

The "Seacoast, NH, Market Sentiment" Analysis

While Seacoast inventory remains historically lean, the market is beginning to “breathe” again as we approach the spring surge. Here is the 2026 outlook at a glance:

  • The “Rate Swap” Effect: As the Fed moves toward rate reductions, we expect “locked-in” sellers to finally list, allowing them to trade into new homes without a significant jump in monthly costs.

  • The Renter Shift: High local rents are driving a wave of first-time buyers toward homeownership as a more stable financial hedge.

  • Stable Growth: We have moved past the volatile 2021–2024 price spikes. Expect healthy, sustainable value increases of approximately 2% year-over-year.

  • A “Flight to Quality”: Today’s buyers are paying top-dollar and, in return, are demanding perfection. Turn-key properties in prime locations like Rye, Portsmouth, and New Castle continue to command premium interest.

The Bottom Line: We aren’t in a “boom” or a “break”—we are in a period of strategic stability. For sellers, presentation and precise pricing are now more critical than ever to capture a discerning buyer pool.

Compare Listings

Title Price Status Type Area Purpose Bedrooms Bathrooms