Date: March 15, 2026 Category: Hampton Real Estate Trends Source: PrimeMLS Market Snapshot
As we wrap up the first quarter of 2026, many Hampton buyers and sellers are wondering what direction the market is heading. While full-year predictions are difficult, the early-season data provided by PrimeMLS gives us a startlingly clear look at the current dynamics.
The numbers for Hampton (including all classes from Residential and Land to Commercial and Multi-Family) tell a dramatic story.
If you are a buyer, seller, or simply a concerned neighbor trying to get a pulse on local real estate, here is our deep dive into the January, February, and March numbers.
Understanding the Graph: A Seasonal Myth?
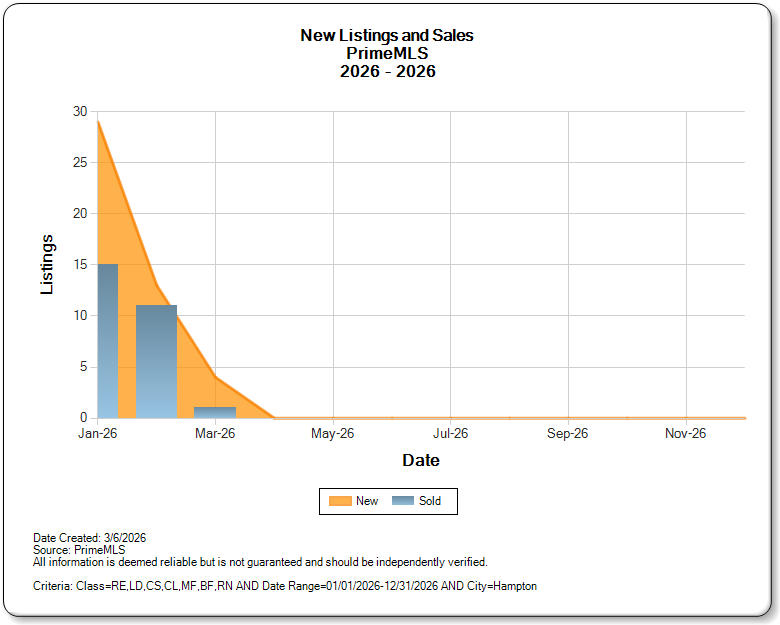
First, looking at the graph, a user’s eye might immediately jump to the sharp decline after January. It might appear that the Hampton market ground to a complete halt in March and flatlined for the remainder of the year.
It’s crucial to understand why this is not true.
The report provided was created on March 6, 2026. This means that the data shown for March only represents the activity recorded during the first six days of the month. The lack of data from late March onwards is simply a reflection of the “data cutoff” date, not a cessation of market activity.
However, even when adjusting for that cutoff, the numbers for the first two months tell an important, urgent story.
The January Surge and High Absorption
The year started with an immense amount of buyer and seller enthusiasm. In January, the Hampton area saw nearly 30 new listings come to the market. This surge in inventory was met with an almost equal surge in buyer demand, with 15 properties being sold.
While selling 50% of your current month’s new inventory in that same month is standard, it was the following month where the scarcity became alarming.
In February, new listings plummeted. Only 12 new properties (combined classes) were brought to the market. Despite this drastically reduced availability, buyer activity barely slowed down, with 11 properties sold.
The Bottom Line: Total Absorption
This February dynamic is the defining characteristic of the early 2026 market. When 11 properties are sold and only 12 new properties are added, you are effectively selling nearly 92% of your monthly intake.
This means that the carryover inventory (unsold properties from previous months) is the only available supply, and that existing backlog is likely being depleted rapidly.
What This Data Means for You
Based on this trend, the Hampton market in early 2026 is an extreme case of a seller’s market driven by scarcity.
For Sellers: If you were thinking of waiting until “peak spring” to list your property, this data suggests you should list now. Demand is outstripping supply nearly dollar-for-dollar. With so little new inventory coming on in February, your property will have almost zero competition if you act today.
For Buyers: This market is blistering. When 92% of new listings are absorbed immediately, there is no time for slow decision-making or aggressive low-balling. If you see a property you love, you must be prepared to act quickly, have your pre-approvals in hand, and make a competitive, clean offer immediately.
Looking Toward Summer 2026
While the flatlines for later months on the graph are just placeholders for a future report, the scarcity identified in February is real. Hampton real estate is currently defined by a severe inventory bottleneck.
If new listings do not see a significant, rapid increase in the second quarter, the competition for the few available properties in Hampton will reach intense levels as the peak moving season arrives.
We will continue to monitor this situation and provide updates as soon as the full Q2 data becomes available in July. Stay prepared, Hampton.
Disclaimer: The data used in this article is based on a specific PrimeMLS snapshot generated on 3/6/2026 for Hampton, NH, covering property classes RE, LD, CS, CL, MF, BF, and RN. All information is deemed reliable but is not guaranteed and should be independently verified.